Humino: Monitor Soil Humidity with an Arduino
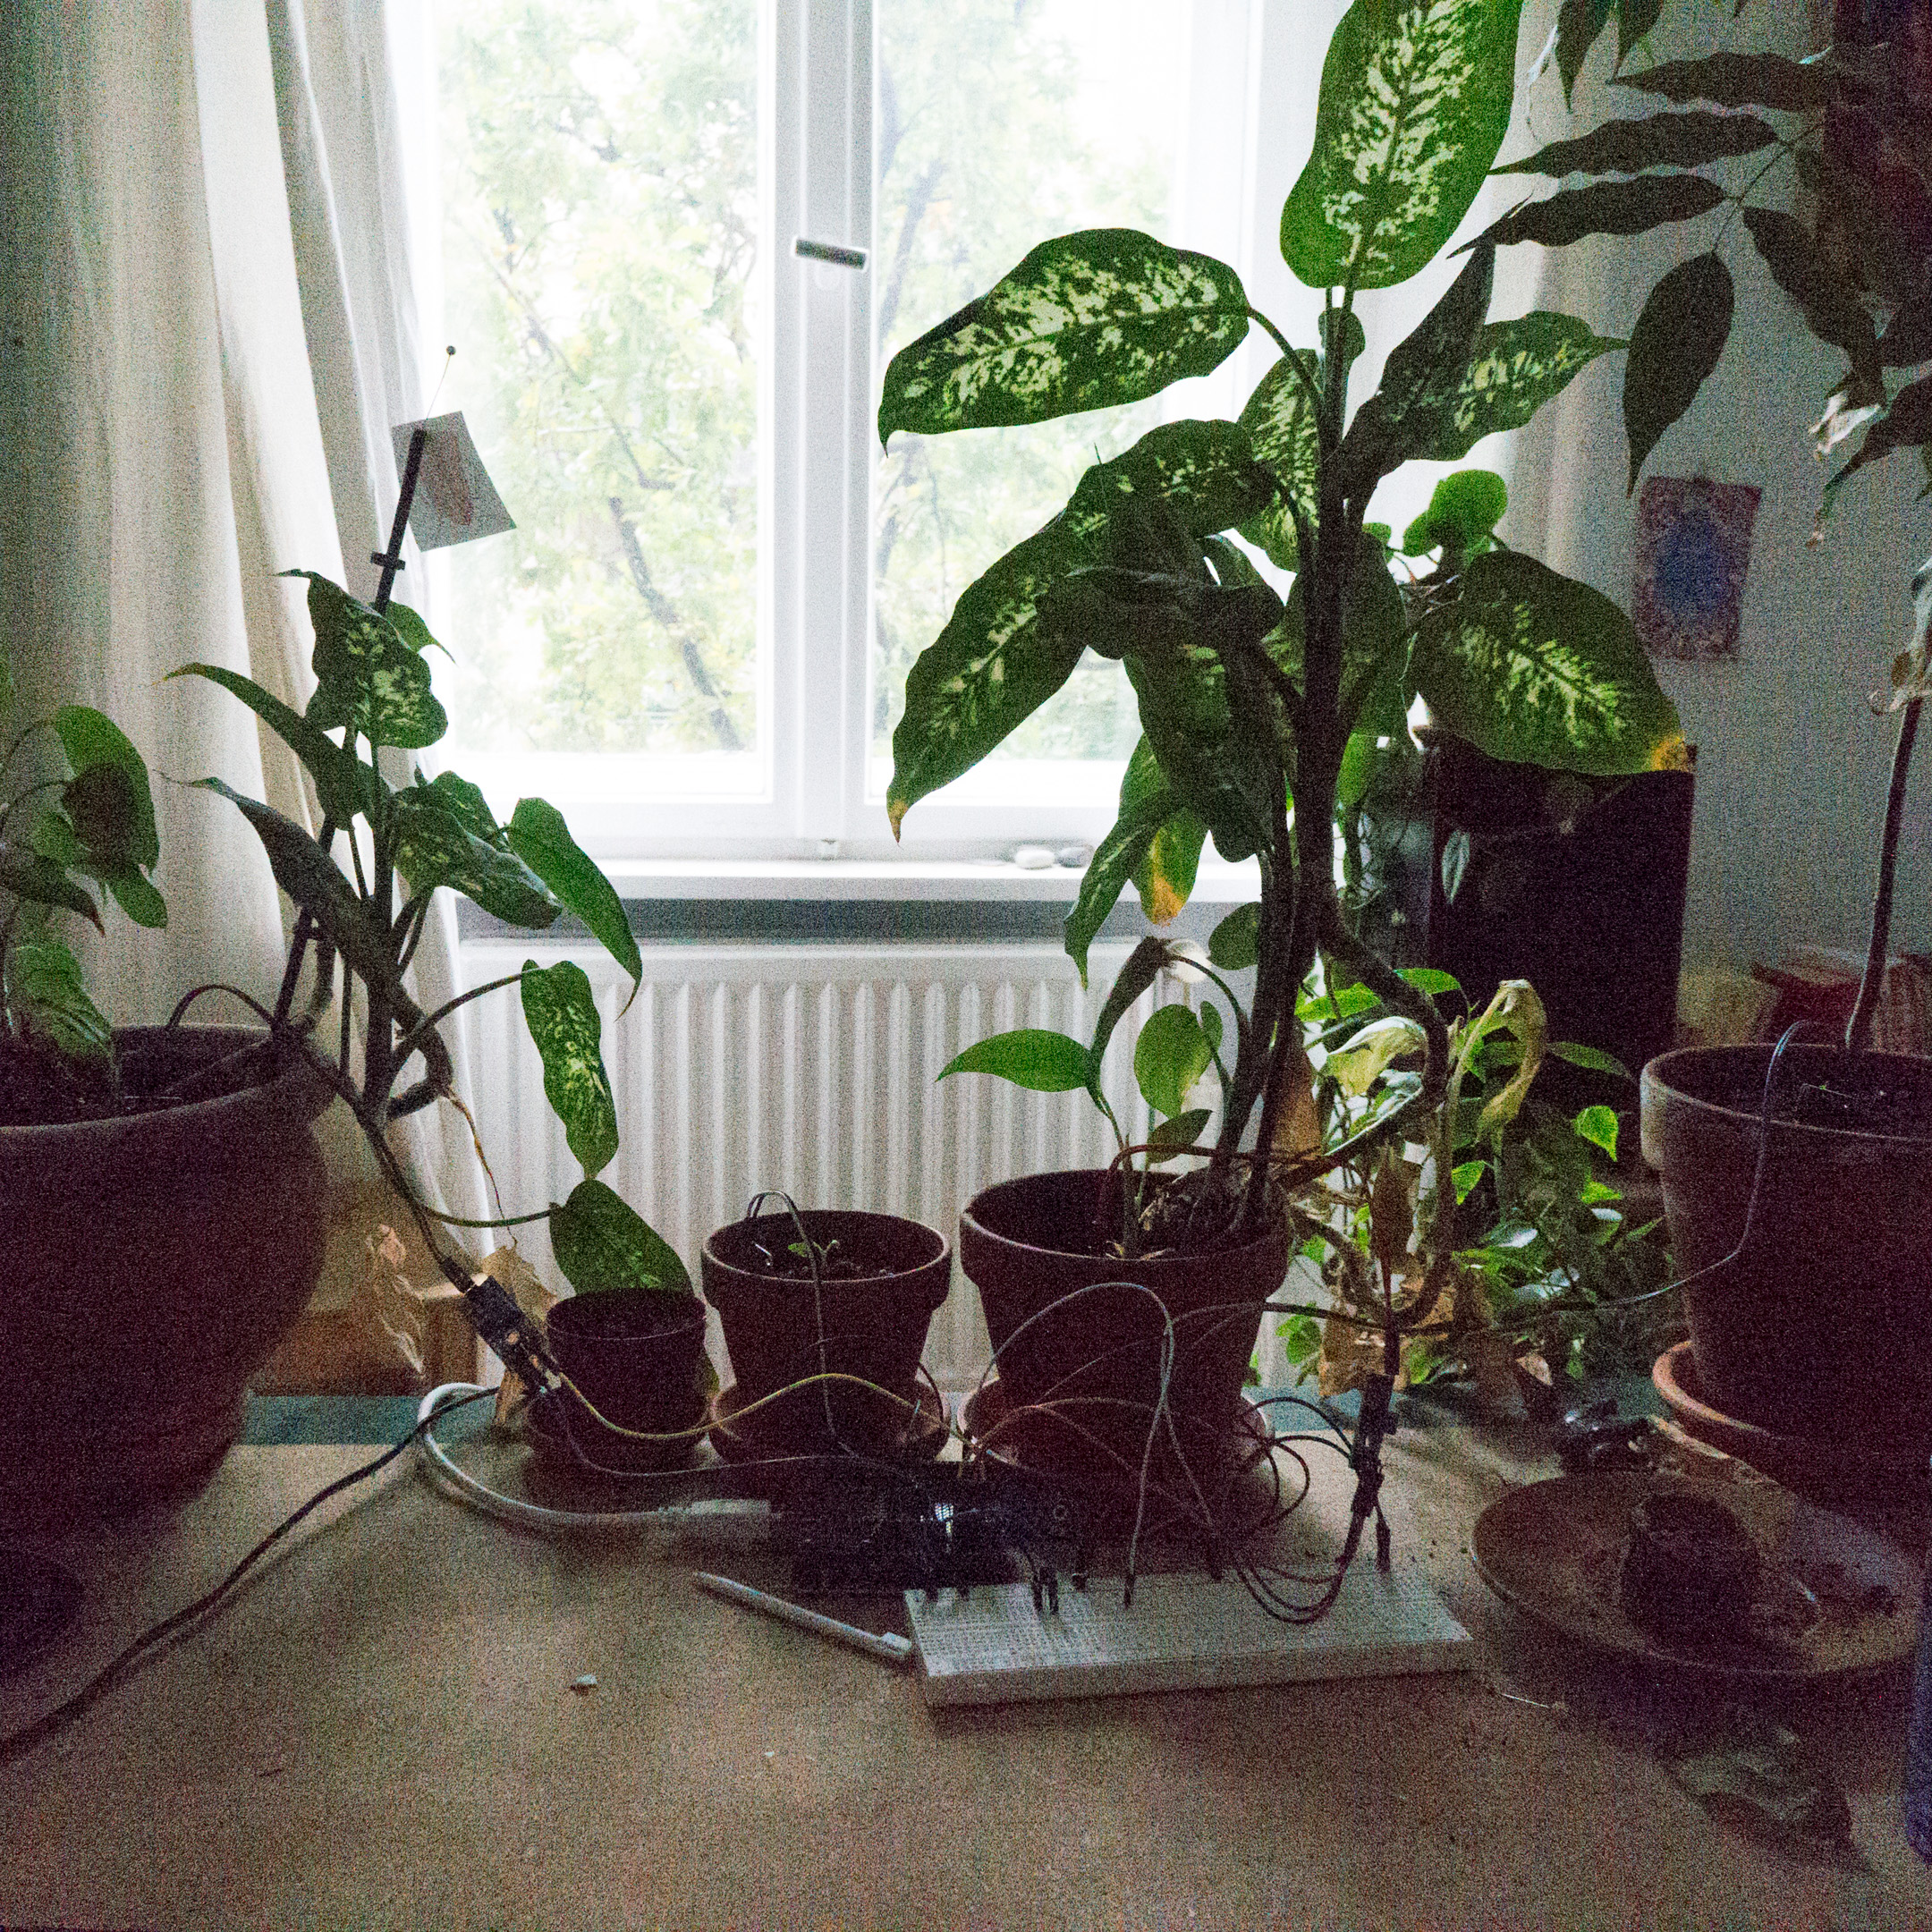
Another thing I wanted to have since I was maybe 5 years old? PLANTS with MICROCHIPS! Probably the hardest part about keeping my green friends alive is making sure that they get enough water even when I am busy with other stuff, on vacation, etc etc. Now that there are cheap Arduinos to have it has gotten quite easy to realise this!
I found some cheap soil humidity sensors on aliexpress (pack of five for 2.50€). When they finally arrived weeks later they had to lay dormant in my electronics cupboard because somehow I had forgotten about this project for a while. Now that I lost two of my beloved banana plants because of insufficient love + care I finally assembled something.
I put a datalogger shield on the Arduino which has an SD card drive and a clock. Then I connected the sensors to the 5V power supply and the Arduino’s analog inputs. Sadly I lost one of the sensors, maybe because I swamped it a bit when I watered the plants. So, if you do this, try not to put the sensors too deeply into the soil. The top part should stay dry!
A bit later I actually learned that it’s better not to have the sensors connected to a power supply all of the time because they will corrode from the constant electricity flowing between its poles in the soil. So I upgraded my initial setup with a TN2222 transistor that switches power for all of the sensors briefly on every time I take a measurement.
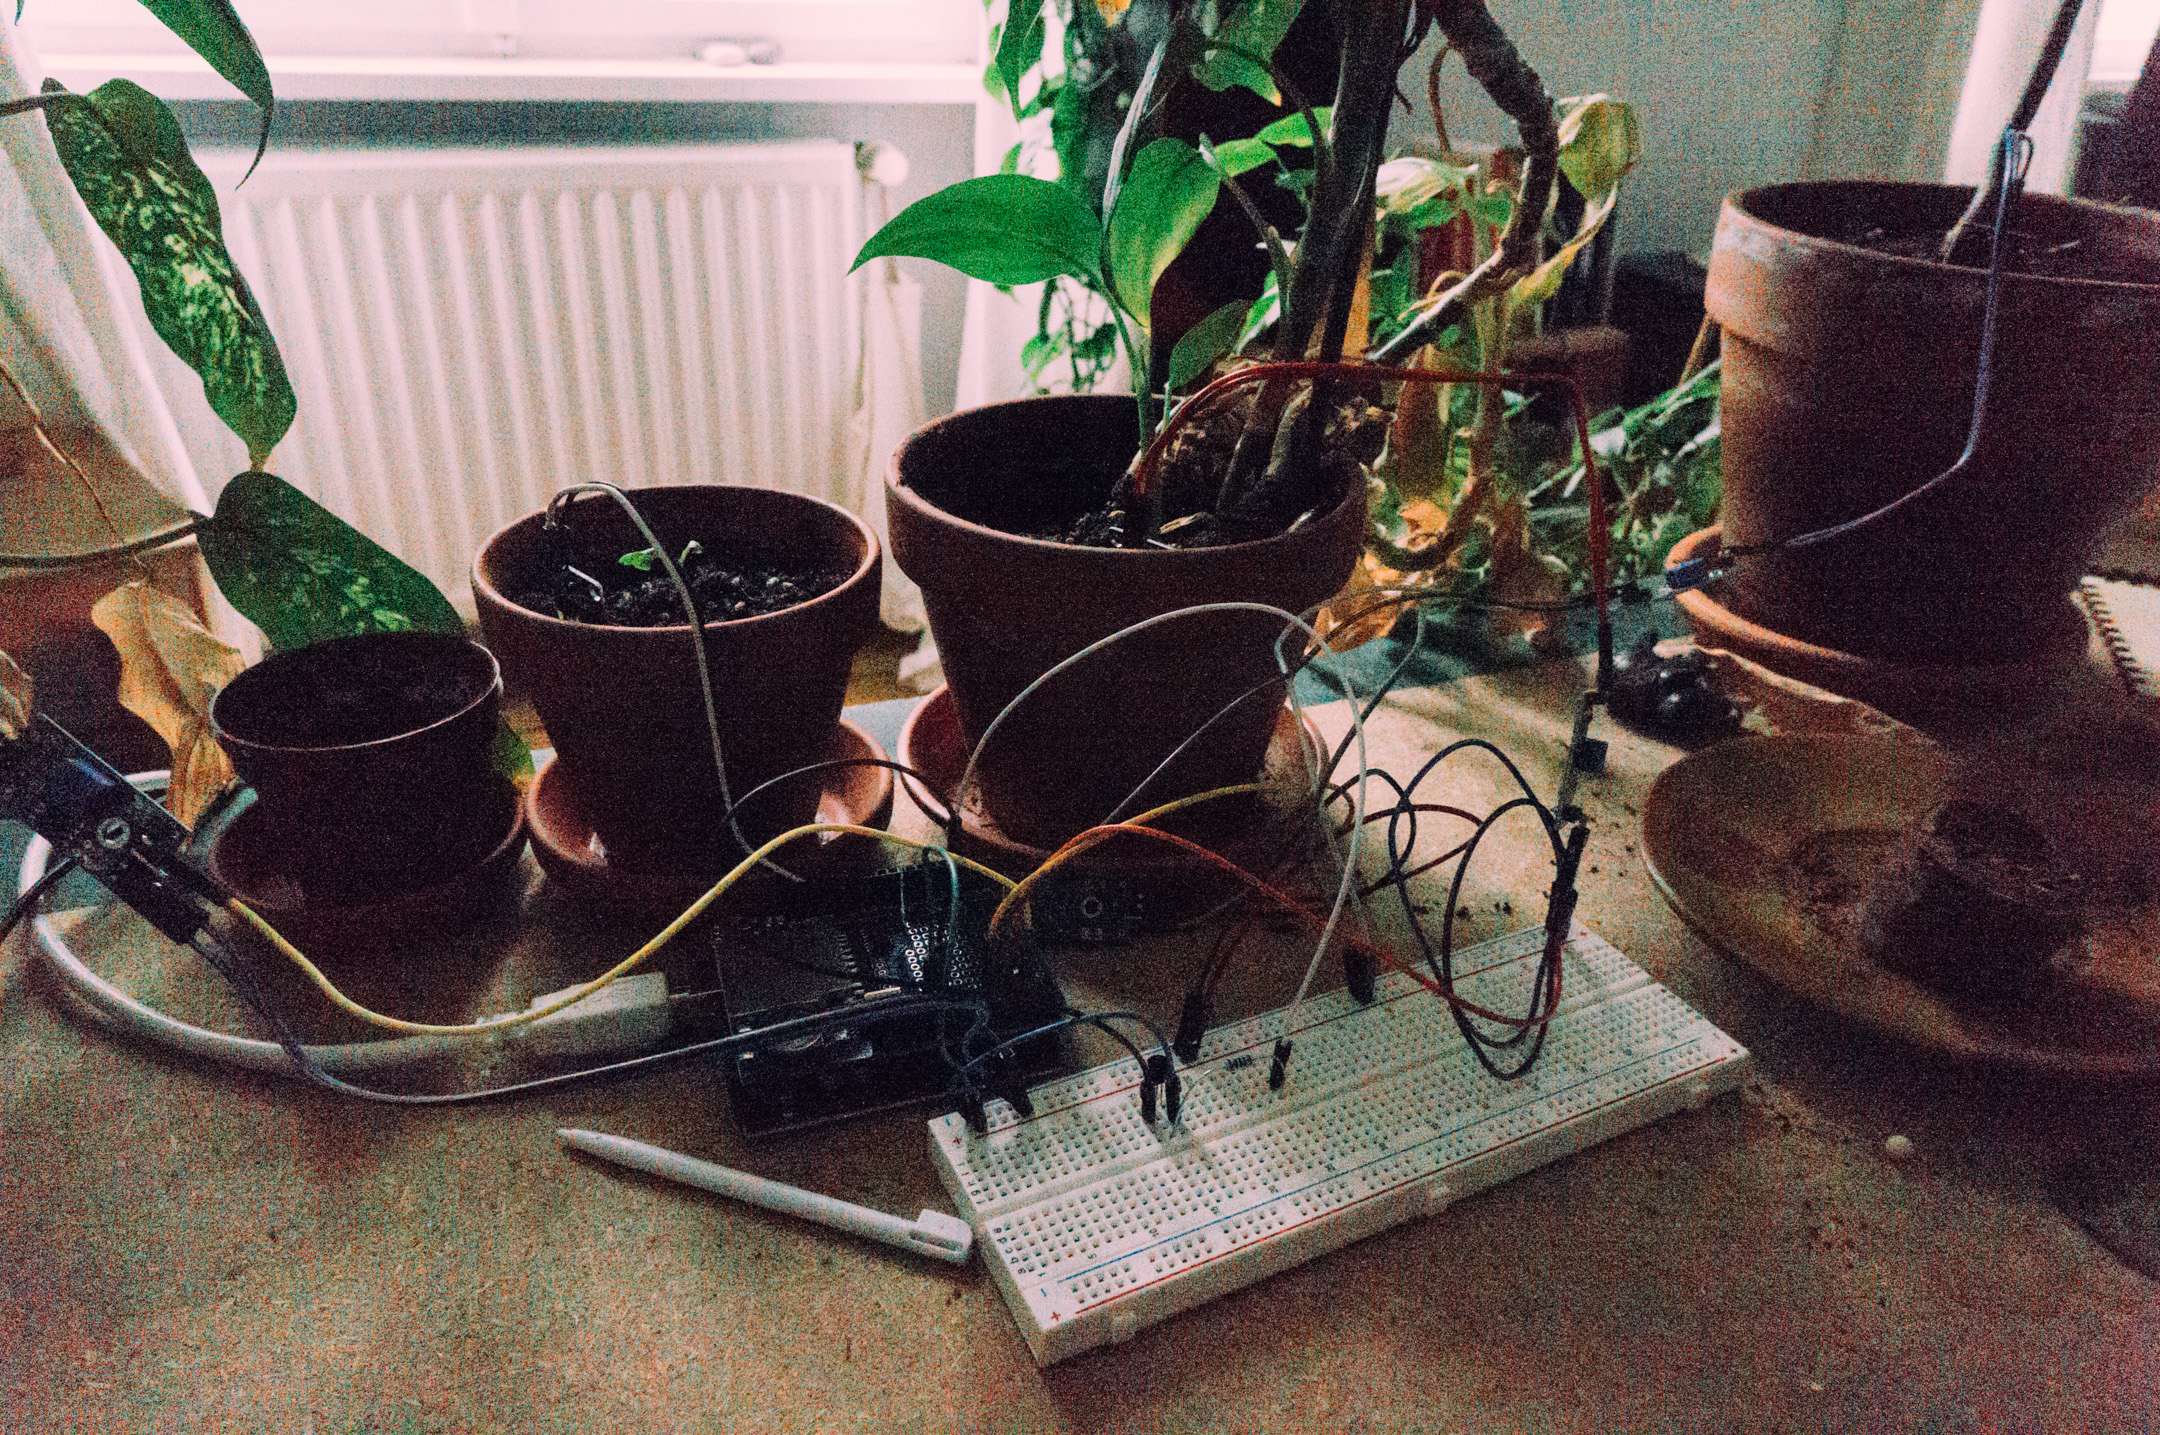
So this is the completed setup for now. Four resistive soil humidity sensors, Arduino with datalogger shield and the breadboard to connect everything and switch it with the transistor.
Here is the Arduino sketch:
#include <DS1307RTC.h>
#include <Time.h>
#include <TimeLib.h>
#include <Wire.h>
#include <SPI.h>
#include <SD.h>

int output_value;
tmElements_t tm;
const int chipSelect = 10;
const int power = 3;
String dataString;
String timestamp;

void setup() {
  pinMode(power, OUTPUT);
  digitalWrite(power, LOW);
  Serial.begin(9600);
  Serial.println("# Setup...");
  while (!Serial) ; // wait for serial
  delay(2000);

  Serial.print("Initializing SD card...");
  if (!SD.begin(chipSelect)) {
    Serial.println("Card failed, or not present");
    // don't do anything more:
    while (1);
  } else {
    Serial.println("card initialized.");
  }
}

void loop() {
  Serial.print("Reading ");
  // Switch transistor
  digitalWrite(power, HIGH);
  delay(1000);
  // dataString will contain each measurement in CSV format
  dataString = "";
  dataString += dt();
  for (int sensorPin = A0; sensorPin <= A3; sensorPin++) {
    Serial.print(sensorPin);
    Serial.print("-");
    output_value = analogRead(sensorPin);
    dataString += ',';
    dataString += output_value;
  }
  digitalWrite(power, LOW);
  writeLog(dataString);
  Serial.println(dataString);
  // I take measurements now every 30 seconds. Maybe I will increase the
  // delay even more
  delay(30 * 1000);
}

void writeLog(String dataString) {
  File dataFile = SD.open("HUMINO.CSV", FILE_WRITE);

  if (dataFile) {
    dataFile.println(dataString);
    dataFile.close();
  } else {
    Serial.println("error opening humino.log");
  }
}

String dt() {
  // Return ISO8601 formatted datetime string
  String rv = "";
  RTC.read(tm);
  rv += tmYearToCalendar(tm.Year);
  rv += '-';
  rv += pad2(tm.Month);
  rv += '-';
  rv += pad2(tm.Day);
  rv += 'T' + pad2(tm.Hour) + ':' + pad2(tm.Minute) + ':' + pad2(tm.Second);
  return rv;
}

String pad2(int number) {
  // Pad numbers to two chars
  String rv = "";
  if (number >= 0 && number < 10) {
    rv += "0";
  }
  rv += number;
  return rv;
}
This produces data like:
...
2018-09-06T13:52:56,353,301,246,430
2018-09-06T13:53:01,354,302,246,431
2018-09-06T13:53:06,354,302,246,431
2018-09-06T13:53:11,354,302,246,432
2018-09-06T13:53:16,353,302,246,432
2018-09-06T13:53:21,354,302,246,432
2018-09-06T13:53:26,354,302,246,433
2018-09-06T13:53:31,354,302,246,434
2018-09-06T13:53:36,351,300,245,429
...
The sensor values are between 0 and 1023 I guess. Higher values mean less humidity. Next, I graphed the results in a Jupyter Notebook using Pandas for data processing and Seaborn for plotting. It’s easy to load data into Pandas dataframes if it comes in this format.
import pandas as pd
import numpy as np
import seaborn as sns
import matplotlib.pyplot as plt
import matplotlib.dates as mdates

# Read data from CSV
raw = pd.read_csv('HUMINO.CSV',
    index_col=0, parse_dates=True)

# Function that convertes raw analog to humidity values
def raw_to_humidity(v):
    return (1023 - v) / 10.23

# Resample the data with a 1-minute interval, fill in
# missing values and apply above conversion function
data = raw
    .resample('1Min')
    .mean()
    .reindex()
    .apply(raw_to_humidity)

# Setup the plot
fig1, ax1 = plt.subplots()
fig1.set_size_inches(11.7, 8.27)
ax1.xaxis.set_major_formatter(mdates.DateFormatter('%m-%d\n%H:%M'))
sns.lineplot(data=data, linewidth=2.5, ax=ax1, dashes=False)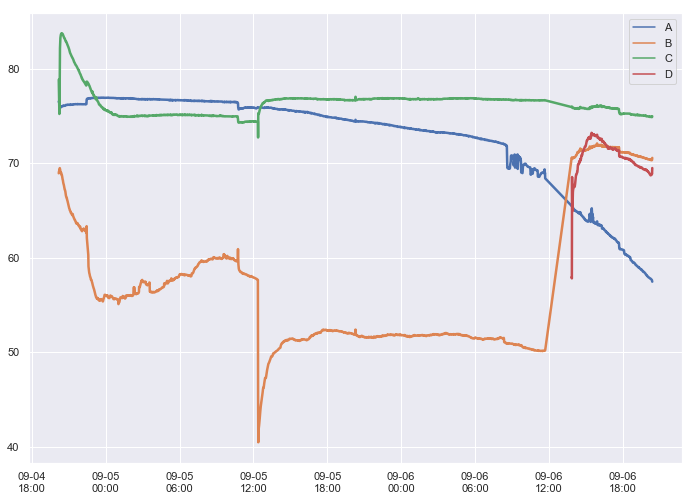
Some observations:
- Sensor measurements change whenever the probe is moved (I did this around 09-05 12:00), so its not possible to define some absolute value that means “the soil is dry now”. I will observe the values and make notes for each plants individual needs.
- Plant B needs more love!
- The value for plant A is exactly what I wanted to see. If the curve is this smooth it should even be possible to predict the next time when the plant will need water.
So, this is a fun project. The next steps are adding a lot of wire and actually soldering everything so that the plants don’t have to sit so close to each other. Then I will want some kind of enclosure for the Arduino and maybe an LCD display for the current values?